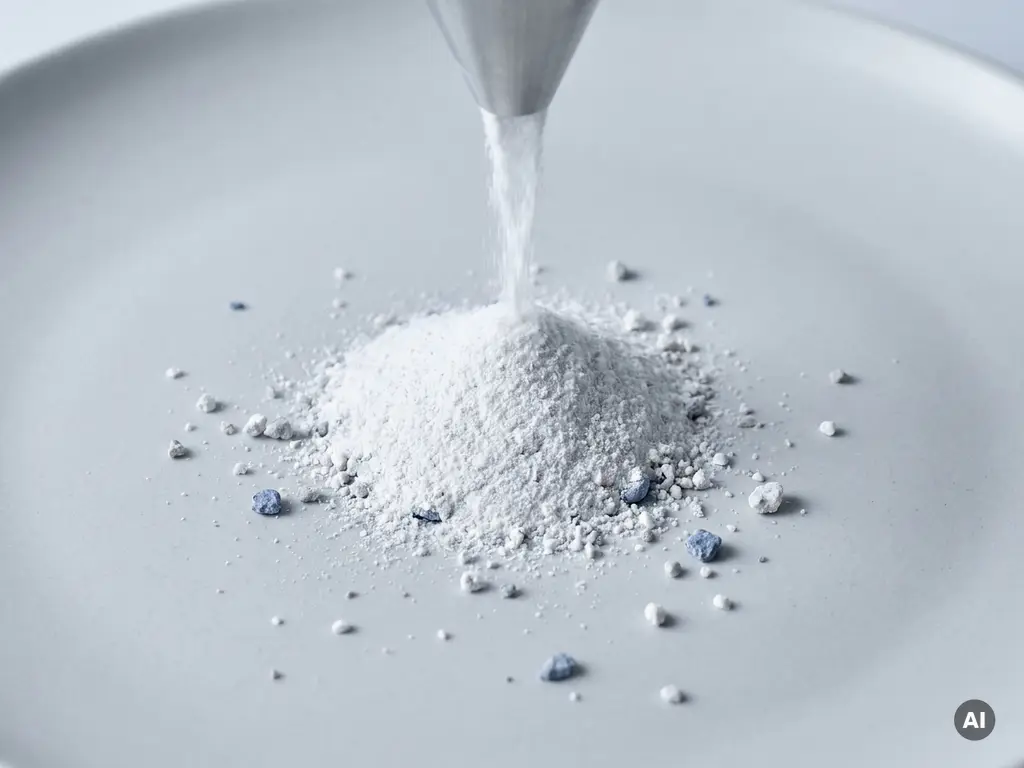
Particle size distribution is important in mineral filler selection because it directly determines how a filler performs within a formulation, influencing surface area, packing density, rheology, opacity, mechanical strength, and processability. A filler with the wrong particle size distribution can compromise end-product quality even when every other specification looks correct. The questions below unpack exactly why PSD matters and how to evaluate it when selecting industrial mineral fillers.
How does particle size distribution affect end-product performance?
Particle size distribution affects end-product performance by controlling the physical and chemical interactions between filler particles and the surrounding matrix. Finer particles increase surface area, which intensifies interaction with binders, resins, or polymers and can improve properties such as opacity, gloss, and tensile strength. Coarser particles reduce surface area but may improve flow, lower viscosity, and enhance scratch resistance.
In paints and coatings, for example, a tightly controlled PSD determines film smoothness, hiding power, and sheen. A distribution that skews too coarse produces visible texture and uneven gloss. In plastics and polymers, filler particle size influences stiffness, impact resistance, and the ease with which the material can be extruded or injection-moulded. In rubber compounds, particle fineness governs reinforcement levels and compound hardness.
The distribution shape matters as much as the average particle size. A broad distribution with a wide spread of fine and coarse particles behaves very differently from a narrow, monomodal distribution centred on the same median value. Formulators who rely only on a single average size figure without examining the full distribution curve risk significant performance variability between batches.
Looking for the right industrial minerals?
Our specialists help you find the right minerals and additives for your application.
What happens when the wrong PSD is used in a formulation?
Using a filler with the wrong particle size distribution in a formulation leads to measurable performance defects that range from processing problems to outright product failure. The consequences depend on whether the PSD is too fine, too coarse, or too broadly distributed relative to what the application demands.
When particles are too fine, viscosity rises sharply, making the material difficult to mix, pump, or apply. In adhesives and sealants, excessive fineness can prevent proper wetting of the substrate and reduce bond strength. When particles are too coarse, surface defects appear, filtration systems become blocked, and mechanical properties such as tensile strength or elongation at break deteriorate. In sealant formulations, coarse particles can puncture thin film layers or create stress concentration points that initiate cracking.
A distribution that is too broad introduces unpredictability. Different batches of the same nominal product may behave inconsistently on the production line, leading to quality control failures that are difficult to diagnose because the root cause is variation within the filler specification rather than a change in process conditions. This is why PSD is not just a technical curiosity: it is a production risk factor that procurement and formulation teams must manage proactively.
How is particle size distribution measured and reported?
Particle size distribution is most commonly measured using laser diffraction, a technique that analyses how a beam of light scatters when it passes through a suspension of particles. The resulting data is expressed as a volume-weighted distribution curve showing the proportion of particles present at each size interval. Sieve analysis is used for coarser materials, while sedimentation and dynamic light scattering are applied for very fine or nano-scale particles.
Suppliers report PSD using percentile values derived from the cumulative distribution curve. The most frequently cited values are D10, D50, and D90, which indicate the particle size below which 10%, 50%, and 90% of the sample volume falls, respectively. Technical data sheets may also include a span value (a single figure that describes how wide or narrow the distribution is) or graphical representations of the full curve.
Understanding how a supplier measures and reports PSD is as important as the values themselves. Different instruments, dispersion methods, and calculation models can produce different results for the same material. When comparing filler specifications across suppliers, it is worth confirming that measurements were made under comparable conditions to ensure the data is genuinely comparable.
What’s the difference between D50 and D90 in filler specifications?
D50 is the median particle size, the point at which half the sample volume consists of particles smaller than that value and half consists of particles larger. D90 is the coarse end cut-off, indicating the size below which 90% of the sample volume falls. Together, D50 and D90 give a practical picture of both the typical particle size and the presence of coarse outliers within a filler grade.
D50 is the most quoted single value in filler specifications because it describes the central tendency of the distribution. However, D50 alone can be misleading. Two fillers with identical D50 values can have very different D90 values, meaning one contains a significant proportion of coarse particles that the other does not. In sensitive applications such as thin-film coatings, surface-critical flooring systems, or fine ceramics, those coarse particles, even if they represent only 10% by volume, can cause surface defects, processing problems, or mechanical failures.
D90 therefore functions as a quality control threshold for the coarse tail of the distribution. Formulators working in ceramics and refractory applications, for instance, often specify a maximum D90 value to prevent oversized particles from creating weak points in fired bodies. Procurement teams should treat D50 and D90 as complementary data points rather than alternatives: both are needed to assess whether a filler grade is fit for a specific application.
Which mineral fillers are most sensitive to particle size variation?
Mineral fillers used in high-performance or surface-critical applications are the most sensitive to particle size variation. Calcium carbonate, barium sulphate, calcined kaolin, talc, and titanium dioxide are among the fillers where PSD control has the greatest impact on end-product quality, because these materials are widely used in applications where optical properties, surface finish, and rheological behaviour are tightly specified.
Calcium carbonate is perhaps the most PSD-sensitive filler in common industrial use. In paints, a shift in particle size distribution changes gloss levels, hiding power, and film build. In building and construction products such as renders and mortars, PSD affects workability and final surface texture. Barium sulphate, used extensively in high-gloss coatings and rubber compounds, requires a very narrow distribution to deliver the chemical inertness and surface smoothness these applications demand.
Calcined kaolin is particularly sensitive in applications where both optical and rheological performance matter simultaneously. In printing inks, for example, particle size governs ink flow, colour strength, and printability. Bentonite, used as a rheology modifier and in agriculture, is highly sensitive to particle size because its swelling behaviour and suspension properties depend on the proportion of fine platelets present. For any filler where surface area drives performance, even small shifts in PSD can produce measurable changes in the final product.
How should procurement teams evaluate PSD when comparing filler suppliers?
Procurement teams should evaluate particle size distribution by requesting full PSD data, not just D50, from each supplier, and by verifying that measurements were made using comparable methods and instruments. The evaluation should focus on three things: the median particle size (D50), the coarse fraction (D90), and the consistency of the distribution across multiple batch certificates.
Batch-to-batch consistency is often more commercially important than the absolute PSD values. A supplier who consistently delivers a filler with a slightly different D50 than the nominal specification causes far less production disruption than one whose PSD varies unpredictably between deliveries. Procurement teams should request historical certificate of analysis data spanning multiple batches before approving a new filler supplier, rather than relying on a single sample measurement.
When comparing suppliers, it is also worth investigating the measurement conditions behind the data. Ask whether laser diffraction or sieve analysis was used, what dispersion medium and dispersant concentration were applied, and whether the instrument was calibrated to a recognised standard. These details determine whether two suppliers’ data sheets are genuinely comparable or whether apparent differences in PSD are artefacts of measurement methodology.
Working with a technically knowledgeable distribution partner simplifies this evaluation considerably. SOD.DEL’s technical team routinely supports procurement and formulation teams in interpreting supplier data sheets, aligning filler specifications to application requirements, and identifying alternative grades when a current supply is underperforming. For teams sourcing mineral fillers across multiple product lines, consolidating through a single partner with deep application knowledge reduces both procurement complexity and technical risk. To discuss filler specifications for a specific application, contact the SOD.DEL team directly.